Liability Premiums Up Double Digits: Using Operating Data to Improve Your Underwriting Position
A hotel produces a daily record of how well it controls its liability exposures, and almost none of it reaches the underwriter. An incident log tied to camera footage, maintenance records that prove the stair was checked, leak and fire sensors with a response history, and a renewal package that assembles itself 120 days out give the carrier evidence it can price, in a year when general liability and umbrella keep climbing.
The controls section of a hotel liability application is mostly checkboxes. Is there a written slip-and-fall procedure? Yes. Trafficking awareness training? Yes. Security cameras? Yes. Every owner in the submission pile checks the same boxes, so the boxes tell an underwriter almost nothing about which hotel is the better risk.
I owned ten hotels, and I built Collective Retreats to ten outdoor locations before it was acquired in 2025. Luxury tents on open ground and a hotel lobby on a wet morning are very different exposures. The application asked about both in roughly the same boxes.
Meanwhile the hotel itself produces a running record of how well it controls those exposures. Work orders. Door and camera logs. Sensor alerts. Training completions. Incident reports, when someone bothers to file them. That record almost never reaches the underwriter in a form they can use.
This piece is about turning it into one.
The Problem: Liability Is the Line That Won't Come Down
Hotel insurance in 2026 is two markets moving in opposite directions. Property has softened hard. Amwins reported that hotels in favorable geographies were commonly getting premium reductions of 15 to 25 percent on property, after years of increases that in some cases topped 150 percent. The same report says liability premiums keep climbing as social inflation, nuclear verdicts and wider exclusions squeeze carrier appetite.
The numbers on the casualty side are blunt. IMA's Q1 2026 hospitality report estimated general liability up 5 to 15 percent for operators with favorable loss history and 15 to 30 percent for those without, with umbrella and excess up 10 to 20 percent. Marsh's second-quarter index had global commercial rates down for an eighth straight quarter while U.S. casualty rose 7 percent, as summarized by Donegan.
Fewer carriers want the business. Paul DiBenedetto, who leads Hub International's franchise practice, told Hotel Dive the pool of insurers writing hotels has shrunk from about 25 five years ago to about 10, with only three real options for most owners. In the same piece, AHLA put nuclear verdicts at more than $31 billion in total awards in 2024, roughly double the year before, and DiBenedetto described ordinary slip-and-fall claims that used to settle around $100,000 now reaching six and seven figures. Forty-three percent of owners in an AHLA survey named insurance among their biggest financial pressures.
Capacity is the quieter problem. Lockton has reported that $5 million lead umbrella layers are now common and some insurers offer only $2 million, per Donegan's 2026 coverage guide. Gallagher's fall 2025 update described owners buying clean coverage forms at the cost of a $100,000 to $250,000 self-insured retention. A bigger retention means the hotel pays more of each claim itself, which makes every avoided or defended claim worth more to the owner than it used to be.
All of this lands on a line that was already growing. CBRE found hotel insurance premiums rose 17.4 percent in 2024, and even after some relief in 2025, CBRE's 2025 review had insurance costs still about double what owners paid in 2019.
| Line | 2026 rate direction | Source |
|---|---|---|
| General liability, favorable loss history | Up 5% to 15% | IMA |
| General liability, unfavorable loss history | Up 15% to 30% | IMA |
| Umbrella and excess liability | Up 10% to 20% | IMA |
| U.S. casualty, all industries | Up 7% (Q2) | Marsh via Donegan |
| Hotel property, favorable geography | Down 15% to 25% | Amwins |
Read the first two rows together. The gap between them, roughly ten to fifteen points of rate increase, is what the market charges for a bad loss history. That gap is the part of the premium an owner has the most say over.
The Data: Where Hotel Liability Losses Come From
Most hotel liability losses are people falling down. Zurich's analysis of its hospitality book puts the average hotel liability claim at $14,500 and names parking lots among the most common places guests fall. Distinguished, reviewing more than 27,000 hospitality claims over 17 years, found over half came from slips, trips and falls, led by uncarpeted floors and then stairs, steps and ramps.
Average claims aren't what move the market, though. Severity does. Baldwin's mid-year report points to third-party litigation funding, now an estimated $16 billion industry, as fuel for larger verdicts across hospitality. A fall that would have settled quietly a decade ago can now go to a jury.
The second exposure is newer and harder. Insurers have tightened sharply on human trafficking after multimillion-dollar verdicts against hotels, and Verisk's ISO unit issued a human trafficking exclusion form that carriers had asked for; Business Insurance counted at least 12 states that mandate some level of trafficking training for hotel staff. Gen Re's review of the exposure noted the exclusion's expected January 1, 2026 effective date. Assault and battery, abuse and molestation, and liquor liability sit in the same bucket of severe, hard-to-place risks, as Marsh McLennan Agency laid out in April.
Water and fire belong on the property side of the program, and they still belong in this piece. They're where the market is softest right now, so documented controls there buy better deductibles and terms today. Non-weather water damage runs about $13 billion a year in U.S. property losses, and a single leak in a multi-floor building can cascade for days before anyone sees it.
The Framework: What an Underwriter Is Actually Pricing
Two mechanisms set a liability premium beyond the base rate.
The first is loss experience. Five years of loss runs tell the carrier how often the hotel has had claims and how expensive they were. That's the favorable-versus-unfavorable split in the table above.
The second is judgment about the risk as it stands today. On filed rates, this often takes the form of schedule rating: credits and debits for things like management, premises condition and safety programs. Washington's rule is a useful example. It caps schedule credits and debits on commercial general liability at 25 percent either way, and requires that the rating be based on specific information supporting the decision. Much of hospitality now sits in the excess and surplus market, where IMA's Tim Smith describes rising retentions and tighter appetite. There, pricing is even more a matter of the underwriter's read on the account.
Both mechanisms run on evidence. So the question for an owner is simple: what evidence does the hotel already produce, and what would it take to hand it over in a form an underwriter trusts?
Underwriters trust three kinds of proof. Frequency, normalized to exposure, so a 400-key resort and a 90-key select-service can be compared. Defensibility, meaning that when something does happen, the hotel can show what the floor looked like and when it was last checked. And persistence: a timestamped trail showing the program runs every day, not only the week before renewal.
| Exposure | Control | Evidence underwriters will accept | Lines affected |
|---|---|---|---|
| Slips, trips and falls | Zone inspections, wet-weather protocol, lighting checks | Timestamped inspection logs, work orders closed with photos, incident frequency per occupied room night | GL, umbrella |
| Defense of claims | Automatic video preservation around incidents | Retention policy plus a log of preserved clips matched to incidents | GL, umbrella |
| Human trafficking, abuse | Annual training for all staff, escalation protocol | Completion records by employee and date, escalation log, written policy | GL, A&B / SAM coverage |
| Security incidents | Key-card access control, exterior lighting, patrols | Access-control audit reports, lighting uptime, patrol checkpoint scans | GL, A&B |
| Non-weather water | Leak sensors with automatic shutoff | Device inventory, alert and response history, shutoff test records | Property, water deductible |
| Fire | Sprinkler and alarm inspection program | NFPA inspection and test records, monitored panel status | Property |
The Mechanism, Part 1: An Incident Log That Feeds Itself
Most hotels log incidents on paper, in a shared inbox or not at all. The first build is a structured incident record that staff can complete on a phone in under two minutes.
Location comes from a fixed property map broken into zones (porte-cochere, lobby entry mats, pool deck, parking row C, stairwell 2) so every report lands on the same coordinates. Time is automatic. Photos are required. A staff member can dictate what happened and a language model drafts a factual narrative for the manager to approve, written without speculation about fault. Near misses go in the same log, because near misses are where the trend shows up first.
Every new incident does two things automatically. It asks the video system to preserve footage from that zone for a window before and after the reported time. And it opens a linked work order if a condition caused it: a cracked stair nosing, a dead fixture, a mat that curls.
That first link matters more than it sounds. A lot of camera systems overwrite footage after a few weeks, and a claim can arrive months later. Losing video that existed is a bad position to defend from.
Camera analytics add the part staff can't. Verkada, for example, sells on-camera slip-and-fall detection that alerts staff in near real time and archives the clip automatically. The same class of model can flag water on a lobby floor at the entrance during a storm. The hotel's own policy has to draw the lines: no cameras where guests have an expectation of privacy, defined retention, and a named person who can release footage to the carrier or counsel.
Over a few months, the log produces the number underwriters want and almost never get from a hotel: incidents per 10,000 occupied room nights, by cause and zone, trended. A 150-key hotel at 72 percent occupancy runs about 39,400 occupied room nights a year. Eight logged falls is 2.0 per 10,000. If the wet-weather protocol takes that to 1.0 the next year, that's a fact an underwriter can price.
The Mechanism, Part 2: Maintenance Records That Prove the Stair Was Checked
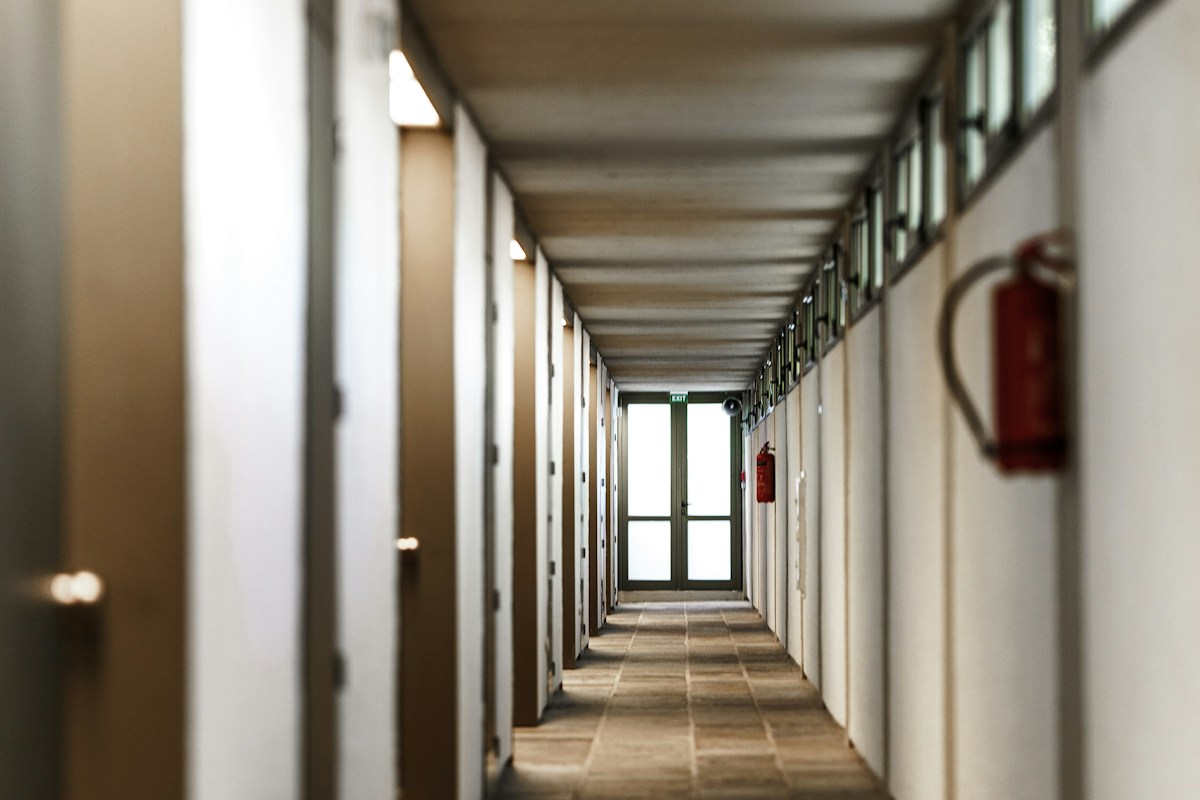
The extinguisher in the hallway above has an inspection tag. Most hotels keep those tags current. Far fewer can pull up the history behind every tag, handrail and light in the building in under a minute when a lawyer or an underwriter asks.
A computerized maintenance system already holds most of it, if the hotel uses it that way. Preventive tasks for handrails, stair treads, exterior lighting, pool-deck surfaces, parking-lot paving and entry mats, each with an interval and a completion record. Floor walks recorded by scanning a QR or NFC tag at each checkpoint, which turns "we walk the property hourly" into a log with timestamps. Lighting uptime pulled from the building management system or smart switches, so a dark stairwell shows up as an alert and a work order rather than a guest complaint.
Weather is where automation earns its keep. A forecast feed watches for freezing rain, snow or heavy rain. When it hits a threshold, the system pushes the wet-weather or ice protocol to the right shift: mats out at every entry, salt on the walks at set intervals, cones staged. Each step is checked off with a photo and a time. In Aspen, where I live, the gap between a salted walk and an unsalted one at 6 a.m. is the whole case.
Our piece on predictive maintenance for hotel engineering covers the equipment side. For underwriting, the useful output is narrower: proof that the hazards guests trip on were inspected on schedule, and how fast reported defects were closed.
| Risk category | Source system | Data it produces | Suggested retention |
|---|---|---|---|
| Slips, trips, falls | Incident app, CMMS, floor-walk checkpoints | Zone-coded incidents, inspections, defect close times | Life of the claim period, typically years |
| Claim defense | Video management system with analytics | Preserved clips linked to incidents | Preserved clips held until claims close |
| Weather hazards | Forecast feed plus task app | Protocol triggers and completions with photos | Same as incidents |
| Security | Access control, lighting controls | Door audit reports, lighting uptime | One to three years |
| Training | Learning management system | Completions by employee, course and date | Employment plus several years |
| Water and fire | Leak sensors, fire panel monitoring, inspection vendor reports | Alerts, response times, shutoff tests, NFPA records | Life of the building system |
The Mechanism, Part 3: Sensors on Water, Fire and the Pool
Leak detection is the most mature piece. Wireless sensors go at risers, laundry, kitchens, mechanical rooms, ice machines and under guest-room units, with automatic shutoff valves on the supply lines that can do the most damage. Chubb has run what it calls a war on water damage and had leak systems in more than 300 insured buildings by 2022. On construction projects, ENR reported water-damage deductibles cut by half or more where sensors and automatic shutoff were in place.
The data that matters to the carrier is the alert history, not the device count: how many alerts fired, how fast someone responded, whether the shutoff was tested this quarter. A sensor that's been offline since spring is worse than no sensor, because the submission says it's there.
Fire is mostly a records problem. Sprinkler inspection, testing and maintenance under NFPA 25 produces paperwork that often lives in a vendor's portal or a binder in engineering. Missing records are a recurring reason hotel fire claims get denied. Pulling vendor reports into the same system on a schedule, with a flag when one is late, closes that gap for almost no money.
Pools fit the same pattern on a smaller scale: chemistry controller logs, gate alarm status, signage and depth-marking checks. Pool incidents are rare and severe, which is exactly the profile where a clean daily log changes how a claim plays out.
The Mechanism, Part 4: Training Records and the Trafficking Question
DiBenedetto's advice to owners in the Hotel Dive piece was training, then more training, and he said carriers now require annual, documented trafficking, abuse-prevention and slip-and-fall training for every employee, not only managers. Arch's risk engineers make the same point about documented training, oversight and incident response in their trafficking liability alert.
A learning management system already records completions. The automation is in the gaps. New hires get the courses assigned on day one and a reminder on day seven. A weekly report shows each property's completion rate by department, and anyone overdue goes to their manager. Housekeeping and night audit get the same attention as the front desk, since they see the most.
Escalations need a log too: what staff saw, who they told, what happened next. Software can surface patterns for a manager to review. It should never decide on its own that a guest is suspicious. That decision belongs to a trained person following a written protocol, and the log should show it did.
The Mechanism, Part 5: The Renewal Package That Assembles Itself
This is where the pieces become a premium conversation. A renewal agent, meaning a scheduled pipeline with a language model at the end, runs 120 days before the policy date and builds the package.
It pulls five years of loss runs from the broker or carrier and parses them into a table by date, cause, location and incurred amount. It joins each claim to the internal incident log. Every claim should match an incident; a claim with no incident record is a gap the owner needs to know about before the underwriter finds it. It computes frequency per 10,000 occupied room nights by cause and year, and shows the trend.
Then it builds the controls section: each control from the table above, with its evidence attached as a short report and a link. Sensor uptime for the year. Training completion by department. Inspection on-time rate. Median hours to close a trip-hazard work order. Last, the model drafts a two-page narrative for the broker in plain language, and a person edits it. Nothing goes out unreviewed.
Brokers say this is what wins. In Insurance Journal's September feature, Amwins' Fansler told agents to tell the story rather than just send applications: what controls and security procedures exist, life-safety measures, management experience and prevention efforts. Fansler listed five-plus years of loss runs, COPE data, contracts, trafficking protocols and safety manuals as the core of a good submission, and said to engage markets 60 to 90 days before renewal. Hotel Dive's sources made the same case for owners meeting underwriters directly.
| Package item | Source | How it's produced | Ready by |
|---|---|---|---|
| Five years of loss runs, parsed | Broker or carrier | Requested automatically, parsed into a claims table | 120 days out |
| Claim-to-incident reconciliation | Loss runs plus incident log | Joined by date and zone; unmatched claims flagged | 110 days out |
| Frequency per 10,000 occupied room nights | Incident log plus PMS | Computed by cause, zone and year | 110 days out |
| Controls evidence pack | CMMS, video, LMS, sensors, access control | Monthly reports rolled into a 12-month summary | 100 days out |
| COPE and property values | Engineering and asset records | Updated from capex log and recent appraisal | 100 days out |
| Broker narrative | All of the above | Drafted by model, edited by GM and owner | 90 days out |
What It's Worth: A Worked Example
Take a 150-key full-service hotel whose expiring general liability premium is $70,000 and umbrella is $40,000. The table below prices three renewals using the midpoints of IMA's published ranges, with one assumption added: a documented controls program earns a 10 percent credit on general liability, well inside the 25 percent cap that states like Washington set.
| Renewal scenario | General liability | Umbrella | Total | Change vs. expiring |
|---|---|---|---|---|
| Expiring program | $70,000 | $40,000 | $110,000 | - |
| Unfavorable history, no evidence (GL +22.5%, umbrella +15%) | $85,750 | $46,000 | $131,750 | +$21,750 (+19.8%) |
| Favorable history (GL +10%, umbrella +15%) | $77,000 | $46,000 | $123,000 | +$13,000 (+11.8%) |
| Favorable history plus documented controls (10% GL credit) | $69,300 | $46,000 | $115,300 | +$5,300 (+4.8%) |
The spread between the first and last scenario is $16,450 a year on premium alone. That's the smaller number.
The larger one is the claim. With retentions climbing, a hotel that cuts falls from eight a year to four avoids four claims at Zurich's $14,500 average, about $58,000 of losses that would increasingly come out of the owner's pocket before the carrier pays anything. And the one fall that does turn into a lawsuit is defended with footage, an inspection log and a mat-deployment record time-stamped twenty minutes before the guest walked in.
None of these numbers will match your hotel. Run them with your own loss runs and your broker's quote before you believe them.
Implementation: Start a Year Out, Finish 90 Days Out
The program needs twelve months of data to be worth much at renewal, so the first renewal after you start is partial and the second is the real one. Start anyway.
In the first month, take inventory. List every system that produces safety evidence (PMS, CMMS, video, access control, building management, leak sensors, LMS, fire inspection vendor) and who owns each. Request five years of loss runs. Draw the zone map.
In months two and three, start capturing. Launch the incident app with the zone map, wire it to video preservation and the CMMS, and set up QR checkpoints for floor walks. Turn on the weather-triggered protocols before the first freeze, not after it.
By month six, add leak detection where the water risk is highest, connect the fire inspection vendor's reports, and fix training gaps by department.
For the rest of the year, run the monthly controls report, review trends with the GM and chief engineer, and fix what the data shows. Then let the renewal agent build the package at 120 days and get it to the broker by 90.
One owner-level point. Keep the broker in the loop from month one. A broker who has seen six monthly reports will sell the story far better than one who gets a binder at 60 days. If you want an outside read on which of your systems can already feed this and what's missing, our AI & Technology Scorecard, Reporting & Future-Proofing engagement starts with exactly that inventory.
An underwriter can't see the mats that went out at 5:40 on a sleeting morning. Give them the timestamp, and they can price it.
Frequently Asked Questions
How much are hotel liability insurance premiums rising in 2026?
IMA Financial Group's Q1 2026 hospitality report estimated general liability up 5 to 15 percent for operators with favorable loss history and 15 to 30 percent for those without, with umbrella and excess liability up 10 to 20 percent. Property is moving the other way, with Amwins reporting 15 to 25 percent reductions for hotels in favorable geographies.
Can operating data actually lower a hotel's liability premium?
It can influence both parts of pricing. Loss history drives whether a hotel lands in the favorable or unfavorable band, and fewer, better-defended claims improve it over time. Underwriter judgment, often applied through schedule credits and debits capped at 25 percent in many states, responds to specific evidence about controls. Data does not override market conditions, so the realistic goal is a smaller increase and better terms.
What data do insurers accept as proof of risk controls?
Brokers point to five or more years of loss runs, COPE information, contracts, written safety and trafficking protocols, and safety manuals. Beyond that, timestamped records carry the most weight: inspection logs, work orders closed with photos, training completions by employee and date, leak sensor alert and response history, NFPA inspection records, and incident frequency normalized to occupied room nights.
How does AI help with hotel insurance renewals?
AI is useful at three points. Camera analytics detect falls and spills and preserve footage automatically. Language models turn staff voice notes into factual incident narratives and draft the broker submission narrative for human review. A renewal pipeline parses loss runs, matches each claim to an internal incident record, computes frequency trends and assembles the controls evidence into a package months before the policy date.
What is the most common hotel liability claim?
Slips, trips and falls. Distinguished's review of more than 27,000 hospitality claims found over half came from falls, most often on uncarpeted floors and then stairs, steps and ramps. Zurich puts the average hotel liability claim at about $14,500, and parking lots are among the most common locations. Severe falls can now settle in six or seven figures.
If your renewal is under a year away and your safety records live in five systems and a binder, AI for Hoteliers is where GMs and chief engineers learn to build the incident log and the monthly controls report with tools they already have. I owned ten hotels, and I'd start with the loss runs and the zone map. If that sounds useful, book a free 15-minute call.
Peter Mack is a hospitality technology strategist and founder of HospitalityOS, helping independent hotels and resorts implement AI systems that drive revenue and reduce operational costs. With 25 years in hospitality operations and technology, he has worked with properties of all types and in every region as both a General Manager, Founder, Operator, Asset Manager, and Owner.