Do You Still Need the Brand? The De-Flagging Decision When Off-the-Shelf Tech Replaces the CRS
A 20-year franchise agreement priced the brand reservation system as an enterprise capability. In 2026 that system is a subscription, and more than 1,200 of those agreements expire by 2030. What follows measures the demand the flag actually causes, prices the independent stack that replaces the rest, and runs the break-even by ADR tier before the renewal letter arrives.
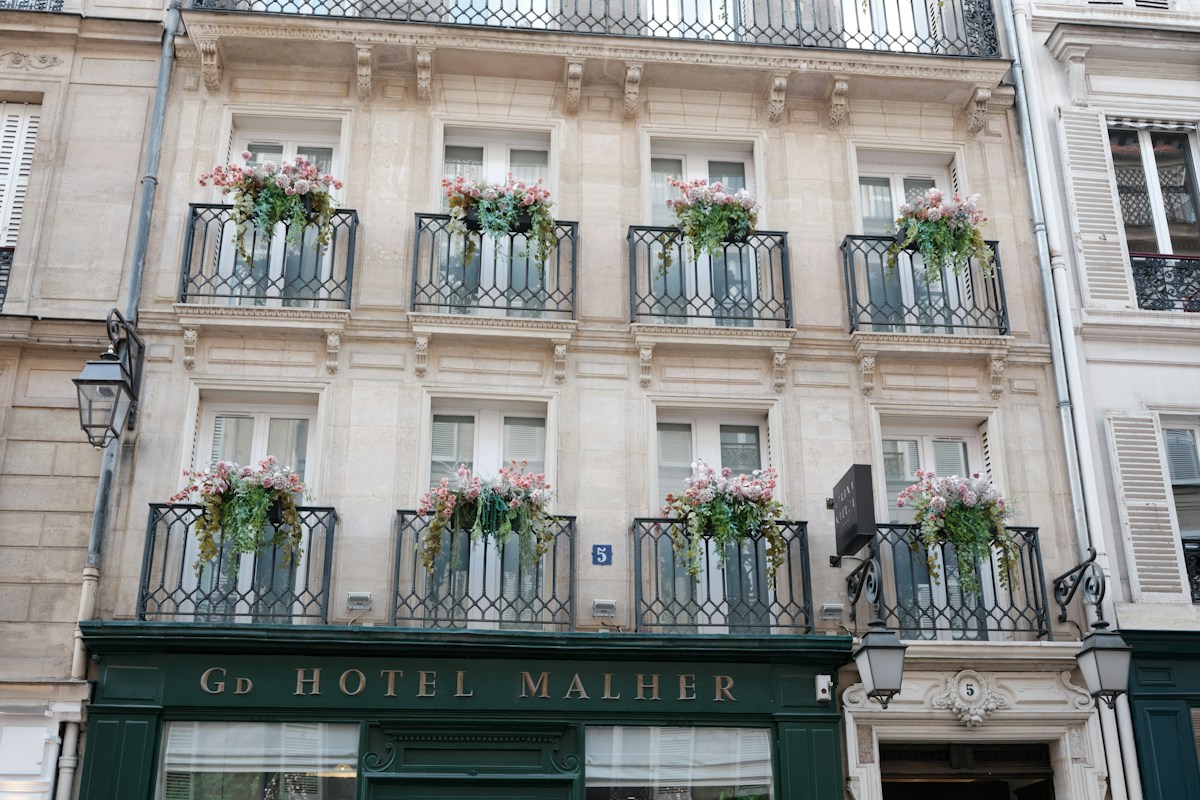
Pritesh Patel's most consequential business decision of 2024, as Skift tells it, was reading a contract. His parents had signed a 20-year deal with Wyndham for a Super 8 in Chariton, Iowa in 2005, and the royalty, marketing and technology charges came to roughly 10 percent of revenue, taken off the top. The reservation system all that paid for was, in Skift's account, one he could replicate with readily available software. He let the agreement lapse, relaunched the property as the independent Hotel Pommier, and according to Skift's June 2026 reporting has since surpassed his branded revenue.
Patel is early, not alone. FRANdata counts more than 1,200 economy and midscale franchise agreements ending by 2030, part of what Skift calls a new generation of 20-year deals reaching expiration. They were signed when a brand's central reservation system, its revenue management desk and its call center were things an owner couldn't buy any other way. Now a cloud property management system, a booking engine, a revenue management system, a channel manager and a metasearch connection are all subscriptions, and Skift's assessment is that off-the-shelf PMS and revenue management software replicates about 90 percent of the brand's operational tools. So the technology question is settled. What's left is whether the remaining 10 percent, mostly loyalty demand, is worth the fee.
The framework below maps each brand capability to its 2026 substitute and prices the substitute. It separates the part of brand demand that software can replace from the part it cannot. It runs the break-even by ADR tier, because the fee stack is a percentage and the technology is mostly a fixed cost, so the answer moves with rate. And it covers the transition risks that turn a good decision on paper into a bad quarter in practice. If you read our total cost of flag audit, this is the next step: you know what the flag costs, now decide whether to keep it.
The Problem: The Fee Keeps Rising and the Bundle Is Coming Apart
A franchise agreement sells five things in one package: distribution, revenue management, a trust signal, a technology stack, and an operating standard. For most of the agreements now expiring, the technology stack was the hard part. In 2005 a central reservation system with GDS connectivity, a brand website that could take bookings, and a rate strategy desk were enterprise capabilities. An independent could not assemble them at any sensible price, so the bundle made sense even when the royalty stung.
The bundle costs more every year. SparkHVA's analysis of 2026 disclosure documents works a 100-room Courtyard at $4 million in room revenue to a contractual load of 10.15 percent before loyalty assessments and application fees. White Sky Hospitality's figures, as reported by Stack Archive, put the average at 8.6 percent of room revenue for economy hotels rising to 12.4 percent for full-service. And CBRE's study of 4,200 hotels found franchise-related fees growing 3.5 percent from 2023 to 2024 against 3.0 percent growth in total operating revenue. The price of the bundle is indexed upward.
The components are not. The 2026 hotel software pricing guide from RoomMaster puts a complete all-in-one platform covering PMS, channel manager, booking engine and payments at $400 to $900 per month for most independent hotels, and a modular stack with revenue management at $600 to $1,500 per month. Smart Order's PMS pricing comparison lands cloud PMS at $4 to $15 per room per month. On a 100-room hotel at $3.5 million in room revenue, even the top of the modular range is about half a percent of revenue. The brand charges ten times that or more, for a bundle whose technology is now a commodity.
What the fee still buys, and what the technology cannot replace, is demand that arrives because of the name on the building. That is the entire decision, so the rest of this article is about measuring it honestly.
The Data: How Much Demand Does the Flag Actually Deliver?
Start with the industry numbers, then bring them down to your property. Writing in Lodging Magazine in September 2026, Kalibri's Jennifer Hill reported from Kalibri's national booking data that loyalty members booked 58 percent of U.S. hotel room nights in the first half of 2026, up from 51 percent in 2019. Brand.com bookings alone are 29 percent of total demand, up from 24 percent in 2019. Loyalty member rate bookings grew 19 percent year over year through the first week of July, while rack and BAR bookings fell 5 percent.
The brand filings are even stronger. Marriott's fourth quarter 2025 results report that member stays accounted for 75 percent of room nights in the U.S. and Canada and 68 percent globally, with membership near 271 million at year end. High Earner Playbook's compilation of 2025 filings shows IHG at 66 percent of room nights consumed by members globally, with 83 percent of room revenue booked through IHG-managed channels, World of Hyatt at 49 percent, and Wyndham at over 53 percent of U.S. check-ins. The table below isn't there to scare you. It shows that the number you need to measure is large, swings enormously by brand, and is the only one that matters.
| Program or market | Member share of room nights | Basis | Direct digital share |
|---|---|---|---|
| Marriott Bonvoy | 75% U.S. and Canada, 68% global | 2025 room nights | Not disclosed |
| IHG One Rewards | 66% global | 2025 room nights consumed | 83% of room revenue via IHG-managed channels |
| Wyndham Rewards | Over 53% U.S., over 37% global | 2025 check-ins | Not disclosed |
| World of Hyatt | 49% system-wide | 2025 room nights, excludes all-inclusive | Not disclosed |
| U.S. market, all hotels | 58% through H1 2026 | Kalibri national booking data | 29% brand.com share of total demand |
Two cautions before you use these numbers. First, member share is not brand-caused share. A member who books your hotel because it is the only decent property near the hospital would have booked it without the flag, and a share of members in any system are enrolled at check-in for the discount rather than choosing the hotel for the points. The conversion-focused brands now courting independents would rather you not make that distinction. Second, the economy and midscale segment where most 2026 expirations sit has far lower loyalty intensity than the Marriott and IHG figures suggest. CBRE found loyalty fees exceed a third of total franchise payments at luxury and upper-upscale hotels but stay under 13 percent at midscale and economy, which is a reasonable proxy for how much of the demand is loyalty-driven at each tier.
The cost side of distribution has been measured, though not recently. Kalibri's research, summarized by Hotel Management in 2017, found hotels paid 13 to 17 percent of a night's rate to acquire a guest through an OTA compared with 3 to 8 percent through brand.com. Kalibri's Cindy Estis Green told PhocusWire that U.S. hotels spent 19.8 percent of what guests paid on customer acquisition in 2015, and that usually only labor is bigger. Treat both as orders of magnitude, not current rates. The independent's job is to keep acquisition cost near the brand.com figure without the brand. That's a software and marketing problem now, and it has a price.
The Capability Replacement Map
The brand sells a bundle. The independent buys components. This table is the map between them, with 2026 price points from the vendor and benchmark sources cited, and an honest note on what each substitute does not do. Bring it to the renewal conversation. It turns a vague argument about brand value into a line-by-line comparison.
| Brand capability | What the flag provides | Independent substitute | Typical 2026 cost | Residual gap |
|---|---|---|---|---|
| Central reservations and PMS | Brand CRS, mandated PMS, call center | Cloud PMS with integrated booking engine and channel manager | $4 to $15 per room per month; $400 to $900 per month all-in for most independents | Voice reservations need a call center vendor or an AI voice agent |
| Revenue management | Brand RMS and regional revenue desk | Independent RMS with AI pricing, integrated to PMS | $200 to $800 per month per property | No brand-wide demand data; the RMS learns from your own history and market feeds |
| Brand.com distribution | Brand website, app, loyalty booking paths | Own website, metasearch via Google Hotel Ads and free booking links, Trivago, Tripadvisor | Google Hotel Ads CPC $0.50 to $3.00; effective acquisition cost 8 to 14% of booking value vs. 15 to 25% OTA commission | Requires sustained spend and bid management; Prostay budgets 6 to 8 hours a week during a 90-day setup, or an agency at 8 to 15% of ad spend |
| Loyalty demand | Member stays, points redemptions, co-brand card traffic | CRM, guest profiles, direct-booking perks, own repeat program | $100 to $300 or more per month for guest communication and CRM, plus perk cost | The one capability software does not replace; see break-even table |
| Trust signal | Name recognition, quality assurance, lender comfort | Review volume, rating, photography, local lenders backing independents | Review management software, priced by vendor | Lender and buyer preference for flagged assets persists in some markets |
| Standards and training | Brand manuals, audits, training portal | Own SOPs, digital training, AI-assisted audits | Mostly internal time, plus training software | Discipline must come from the operator, not the auditor |
Four of the six capabilities have substitutes priced in the hundreds of dollars a month. The trust signal is a slower build but a solvable one. Pixel and Polish, an agency, reports that the boutique and independent hotels in its own portfolio had a median direct booking share of 69 percent between June 2025 and June 2026, at a median cost per direct booking of 9 percent, against the roughly 63 percent OTA share Cloudbeds reports for independents in 2025. It's a self-selected, well-run portfolio, and the publisher sells the service. Still, it shows what's possible. The only capability with no software substitute is loyalty demand, which is why the rest of the decision is about sizing it.
The brand's reservation system was an enterprise capability in 2005 and a few-hundred-dollar monthly subscription in 2026. The fee for it kept rising. The owner's job is to find out what the rest of that fee is buying.
What the Independent Stack Costs at Your Size
Owners who have never priced the stack tend to overestimate it, because the last quotes they saw came from enterprise vendors with five-figure implementation fees. The table below assembles published ranges by property size from the pricing guides already cited. Watch the hidden lines: RoomMaster says they often add 30 to 60 percent to a headline price, and Stayntouch warns they often exceed the headline booking engine price.
| Line | Under 30 rooms | 30 to 80 rooms | 80 to 150 rooms | Pricing basis |
|---|---|---|---|---|
| Cloud PMS with booking engine and channel manager | $100 to $250 per month | $300 to $700 per month | $600 to $1,200 per month | Per room or flat tier; minimums of 10 to 20 rooms common |
| Revenue management system | Within $200 to $800+ per month | Within $200 to $800+ per month | Within $200 to $800+ per month | Per property or share of revenue |
| Booking engine transaction fees | 0.5% to 3% of booking value | 0.5% to 3% of booking value | 0.5% to 3% of booking value, or flat fee | Per transaction; negotiate flat at scale |
| Guest messaging and CRM | Within $100 to $300+ per month | Within $100 to $300+ per month | Within $100 to $300+ per month | Flat or per property |
| Setup, migration and integrations | Varies; some vendors include setup | Varies; per-integration fees at some vendors | Varies; custom integrations $8,000 to $15,000 each | One time plus monthly |
| Payment processing | 1% to 3% plus per-swipe fees | 1% to 3% plus per-swipe fees | 2.5% to 3% of card volume | Same cost flagged or not; benchmark it anyway |
Note what is not on this list: brand marketing assessments, loyalty assessments on member folios, reservation charges per stay, and property improvement plans on the brand's schedule. The technology line is the easy part. Add up the RoomMaster ranges for a 100-room hotel, including an RMS and messaging, and the stack runs roughly $900 to $2,300 per month, or about $11,000 to $28,000 a year, before transaction and payment fees. The hard part is the marketing budget that replaces brand.com, which is the subject of the break-even table.
The Framework: Four Questions Before You De-Flag
The decision reduces to four questions, asked in order. Each has a measurable answer, and the technology that would replace the brand is also the technology that produces the measurement.
1. What share of my room nights is brand-caused, not merely brand-booked? Pull twelve months of reservations from the PMS by source. Separate brand.com and loyalty bookings from OTA, GDS, group, corporate negotiated and walk-in. Then interrogate the brand-booked share: how many of those guests are local negotiated accounts who would book anyway, how many are enrolled-at-desk members, how many redeemed points at a reimbursement below your rate? What survives is your brand-caused demand. For a limited-service hotel in a secondary market it can land far below the 58 to 75 percent the headline figures imply. Yours may be higher. The point is that it's yours.
2. What does it cost to replace that demand with software and spend? Price the stack from the table above, then budget paid direct acquisition. Foundry's 2026 benchmarks put Google Hotel Ads effective acquisition cost at 8 to 14 percent of booking value, and Prostay's metasearch guide puts a properly run metasearch program at an effective acquisition cost of 7 to 12 percent of revenue, with a minimum useful Google Hotel Ads spend of about 500 euros a month. If brand-caused demand is 25 percent of room nights and you replace it at a 12 percent acquisition cost, the replacement budget is 3 percent of total room revenue. That is the figure used in the break-even table.
3. What is the net saving, and what revenue would the brand have to deliver to beat it? Fee stack minus the independent stack minus the replacement marketing budget is the net saving. Divide by your own flow-through on incremental room revenue (the model below assumes 70 percent) and you have the revenue lift the flag must demonstrably deliver to justify itself. If the brand-caused demand you measured in question one, priced at your ADR, is below that figure, the flag does not pencil.
4. What does leaving cost, and when is it free? The answer depends almost entirely on timing. Let the agreement expire and the exit cost is the transition itself. Terminate early and the liquidated damages clause applies. Kilpatrick Townsend's 2011 review of the case law shows courts enforcing formulas based on the prior 36 months of recurring fees or gross room revenue, with awards from $111,325 to $741,713 in the cases reviewed. Michael McGee of Dentons, speaking at the Hospitality Law Conference in 2025, advises owners to negotiate the window to no more than 12 months and cap it at $100,000, and notes that brands have recently pushed for 24-month windows. That clause is the reason the 1,200 expirations matter: at expiry, the largest cost of leaving goes to zero.
The Break-Even by ADR Tier
The brand fee is a percentage of room revenue. The technology is mostly a fixed cost. The loyalty fee intensity rises with the segment. Those three facts mean the de-flag math moves with rate, and the table below shows how. It models a 100-room hotel at 65 percent occupancy, or 23,725 room nights, at four ADR tiers. The fee load uses the published segment ranges: 8.6 percent for economy, 10.15 percent for the SparkHVA upper-midscale example, 11 percent for upscale (our interpolation between the published figures), and 12.4 percent for full-service. The independent stack is $10,800 a year in technology plus 3 percent of room revenue in paid direct acquisition, with an additional 1 percent at the two upper tiers for a CRM-driven repeat program and perks. Flow-through on incremental revenue is 70 percent.
| ADR tier | Room revenue and fee load | Independent stack and marketing | Net annual saving | Lift the flag must deliver to break even |
|---|---|---|---|---|
| $100 economy and midscale | $2.37M; fees $204,000 (8.6%) | $82,000 (3.5%) | $122,000 (5.1%) | $174,000, or 7.3% of room revenue; early exit exposure up to $612,000 |
| $150 upper midscale | $3.56M; fees $361,000 (10.2%) | $118,000 (3.3%) | $244,000 (6.8%) | $348,000, or 9.8% of room revenue; early exit exposure up to $1.08M |
| $220 upscale | $5.22M; fees $574,000 (11.0%) | $220,000 (4.2%) | $355,000 (6.8%) | $507,000, or 9.7% of room revenue; early exit exposure up to $1.72M |
| $300 upper upscale and full service | $7.12M; fees $883,000 (12.4%) | $296,000 (4.2%) | $587,000 (8.2%) | $839,000, or 11.8% of room revenue; early exit exposure up to $2.65M |
Read the last column against question one. At the $100 tier the flag must demonstrably deliver 7.3 percent of room revenue that the property could not acquire on its own. At $300 it must deliver 11.8 percent. Those are not large numbers against member shares of 58 to 75 percent, which is why the brands' case rests on quoting member share. They are large numbers against brand-caused share once local negotiated accounts, enrolled-at-desk members and below-rate redemptions are stripped out. In the economy and midscale segment, where CBRE finds loyalty intensity lowest and where the 2026 expirations are concentrated, that's a hard bar for a flag to clear. In upper upscale, where loyalty demand is real and co-brand cards drive stays, it's a much easier one.
The exit column is the timing lesson. Terminate the $150 tier hotel two years early and the exposure can reach seven figures, which wipes out four years of savings. Let the same agreement expire and the exposure is zero. Owners with agreements ending in 2027 or 2028 should be running this table now, because the transition work described below takes a year to do well.
Member share is the brand's number. Brand-caused share is the owner's number. The gap between them, priced at your ADR and compared with your fee stack, is the entire de-flag decision.
Where the Flag Still Wins
Four situations don't change with the technology. The first is upper-upscale and luxury properties in loyalty-dense markets, where member stays are co-brand card driven and the redemption traffic is real incremental demand; the break-even table shows the required lift is highest there and the brand's ability to deliver it is strongest. The second is group and corporate business that routes through brand sales organizations and GDS negotiated rates, which an independent must rebuild account by account. The third is debt: in some markets, lenders still price flagged assets more favorably, though Skift reports local lenders increasingly backing independents, and a refinancing conversation belongs in the decision. The fourth is the owner who does not want to run marketing. The independent model moves distribution from a fee you pay to a discipline you practice, and if nobody at the property will own the metasearch bids and the CRM, the fee is buying management as much as demand.
There is also a middle path. Soft brands, which Hotels Strategy notes have grown by close to 20 percent over the past decade, keep the loyalty connection with lighter standards, and Hilton's new Outset Collection, announced in October 2025, is an upscale conversion brand pitched at independents. IHG's Garner is a midscale conversion brand from 2023. The same break-even table works for a soft brand: substitute its lower fee stack and its loyalty share, and see whether the lift it must deliver is one it can.
Transition Risks: What Goes Wrong Between the Flag and the Stack
The technology works. The transition is where owners get hurt, and the failures are predictable. Cloudbeds' 2026 de-flagging guide quotes Jason Edwards of Premiere Advisory Group on the central risk: once you lose the brand, there is usually a gap of two to ten weeks before full distribution is back up, and operations continue while revenue generation is what gets missed. The table below lists the risks in the order they hit, with the control for each.
| Risk | What happens | Control | When to act |
|---|---|---|---|
| Distribution gap | CRS and brand channels switch off before the new stack is live; two to ten weeks of lost bookings | Run the cloud PMS, booking engine and channel manager in parallel for 60 to 90 days before exit; pre-load OTA and GDS listings under the new name | Four to six months before expiry |
| Guest data loss | Brand retains centralized profiles and loyalty histories; what is not exported is gone | Export every reservation, folio and profile the agreement allows; build the CRM from PMS history, not brand data | Six months before expiry; check the agreement's data clauses first |
| Google listing and reviews | The business profile may sit under brand control, and review history may not carry over to a new name | Claim or create the profile under ownership control, migrate photography and address, and seed new reviews from the first independent month | Three months before expiry |
| Rate strategy reset | Brand RMS and comp-set feeds vanish; pricing drifts to gut feel | Independent RMS live and trained on 12 months of PMS history before exit; market rate feeds connected | Three months before expiry |
| Liquidated damages or gotcha clauses | Early termination triggers 12 to 36 months of fees; prior defaults or low scores can bar an exit window | Exit at natural expiry; have counsel review the termination, cure and renewal clauses before any notice | Twelve months before expiry |
| Negotiated accounts and groups | Corporate and group business booked through brand channels does not follow the hotel automatically | Direct outreach to every negotiated account with the new booking path; GDS presence through the channel manager | Six months before expiry |
Every row says the same thing: the independent stack has to be live, tested and taking bookings before the brand systems go dark. When Sonder wound down in November 2025, Cloudbeds CEO Adam Harris says his company de-flagged two of its properties into independents in under 36 hours. That's a vendor describing its own work, but it shows the switch itself can be fast when the stack is ready. Nobody facing a 2027 expiry has an excuse for not being ready.
Implementation: Building the Independent Stack Before You Need It
The most useful thing about the independent stack is that you can build and run it while still flagged, which turns the de-flag decision from a leap into a measured transition. Here is the sequence.
Months one and two: measure brand-caused demand. Export twelve months of reservations by source from the brand PMS. Tag every booking as OTA, brand.com, loyalty redemption, negotiated, group or direct. Join negotiated accounts and local repeat guests to the brand-booked set and strip them out. The result is your brand-caused share, by month, which feeds question one and the break-even table. Treat it as a data pipeline, not a one-off spreadsheet. It's also where a technology audit and roadmap engagement starts, because every later decision depends on this number being right.
Months three and four: stand up the stack in parallel. Select a cloud PMS with an integrated booking engine and channel manager, and an RMS that integrates with it. If your agreement permits it, run it in parallel with the brand PMS for direct bookings only, so the RMS learns from live data. Connect Google free booking links and a modest Hotel Ads budget under your own website so you have twelve weeks of conversion and acquisition cost data before you need to rely on them.
Months five and six: build the direct demand engine. Launch the CRM from PMS history, define the direct-booking perk, and start the repeat-guest program. Claim the Google business profile and migrate the review history you are allowed to keep. Begin outreach to negotiated accounts with the new booking path. Measure direct share month by month; Prostay's rule of thumb is that it should rise half a point to a point per month if the metasearch work is being done.
Months seven to twelve: run the break-even on live data and decide. By now you have your own acquisition cost, your own conversion rate, and a measured brand-caused share. Rerun the table with those numbers. If the required lift exceeds what the brand demonstrably delivers, exit at expiry with the stack already live. If it does not, you have a far stronger renewal negotiation, because you can show the brand exactly what it must deliver to keep you. Either outcome is better than signing another twenty years on instinct.
What to Do This Quarter
If your agreement expires within three years, do three things before year end. Read the agreement for the renewal, termination and data clauses, and have counsel confirm the liquidated damages formula and any gotcha provisions. Export twelve months of reservations by source and compute brand-caused share. Price the independent stack from live quotes, not the tables here. Those three inputs give you a break-even the brand, your lender and your partners can all read. They take a few weeks. Have the number before the renewal letter arrives.
Frequently Asked Questions
Can off-the-shelf software really replace a brand's central reservation system?
For the technology, yes. A cloud PMS with an integrated booking engine and channel manager connects to OTAs, metasearch and the GDS, and an independent RMS prices rooms with the same class of algorithms the brands use. Skift's 2026 assessment is that off-the-shelf tools replicate about 90 percent of brand operational systems. What software does not replace is the loyalty demand that flows through the brand's app and card partnerships, which is why the decision is about sizing that demand rather than about the technology.
How do I measure how much demand the brand actually delivers?
Export twelve months of reservations by booking source, then strip the brand-booked set of guests who would have come anyway: local negotiated accounts, members enrolled at the desk, and redemptions reimbursed below your rate. What remains is brand-caused demand. Compare it, priced at your ADR, with the revenue lift the break-even table says the flag must deliver. Member share from brand filings is a ceiling, not a measurement.
What does the independent technology stack cost?
Published 2026 ranges put a complete all-in-one platform at $400 to $900 per month for most independent hotels, with revenue management adding $200 to $800 per month and guest messaging and CRM another $100 to $300. A 100-room hotel should budget roughly $11,000 to $28,000 a year for technology, plus a paid direct acquisition budget of around 3 percent of room revenue to replace brand.com demand. RoomMaster says hidden fees such as transaction charges, integrations and setup often add 30 to 60 percent to headline prices, so get itemized quotes.
What are the costs of leaving a franchise early?
Liquidated damages clauses typically calculate a percentage of gross room revenue or recurring fees over a prior period, with courts enforcing formulas based on the prior 36 months and awards in the cases Kilpatrick Townsend reviewed in 2011 ranging from about $111,000 to $742,000. Dentons' Michael McGee advises negotiating the window to 12 months and capping it at $100,000. At natural expiry the liquidated damages exposure is zero, which is why the timing of the decision matters as much as the math.
When does keeping the flag make sense?
When brand-caused demand, priced at your ADR, exceeds the lift the break-even table requires. That is most often true at upper-upscale and luxury hotels in loyalty-dense markets, at properties with heavy group and corporate business routed through brand sales, where lender terms depend on the flag, and where nobody at the property will own distribution as a discipline. A soft brand is a legitimate middle path and can be tested with the same table.
How long does a de-flag transition take?
Plan twelve months. The independent stack should be live and taking direct bookings in parallel with the brand systems for at least 60 to 90 days before exit, the CRM and Google business profile should be under your control three to six months out, and negotiated accounts need direct outreach before the switch. Owners who skip the parallel period risk the two to ten week distribution gap Cloudbeds describes, in which operations continue but revenue takes the hit.
Peter Mack is a hospitality technology strategist and founder of HospitalityOS, helping independent hotels and resorts implement AI systems that drive revenue and reduce operational costs. With 25 years in hospitality operations and technology, he has worked with properties of all types and in every region as both a General Manager, Founder, Operator, Asset Manager, and Owner.